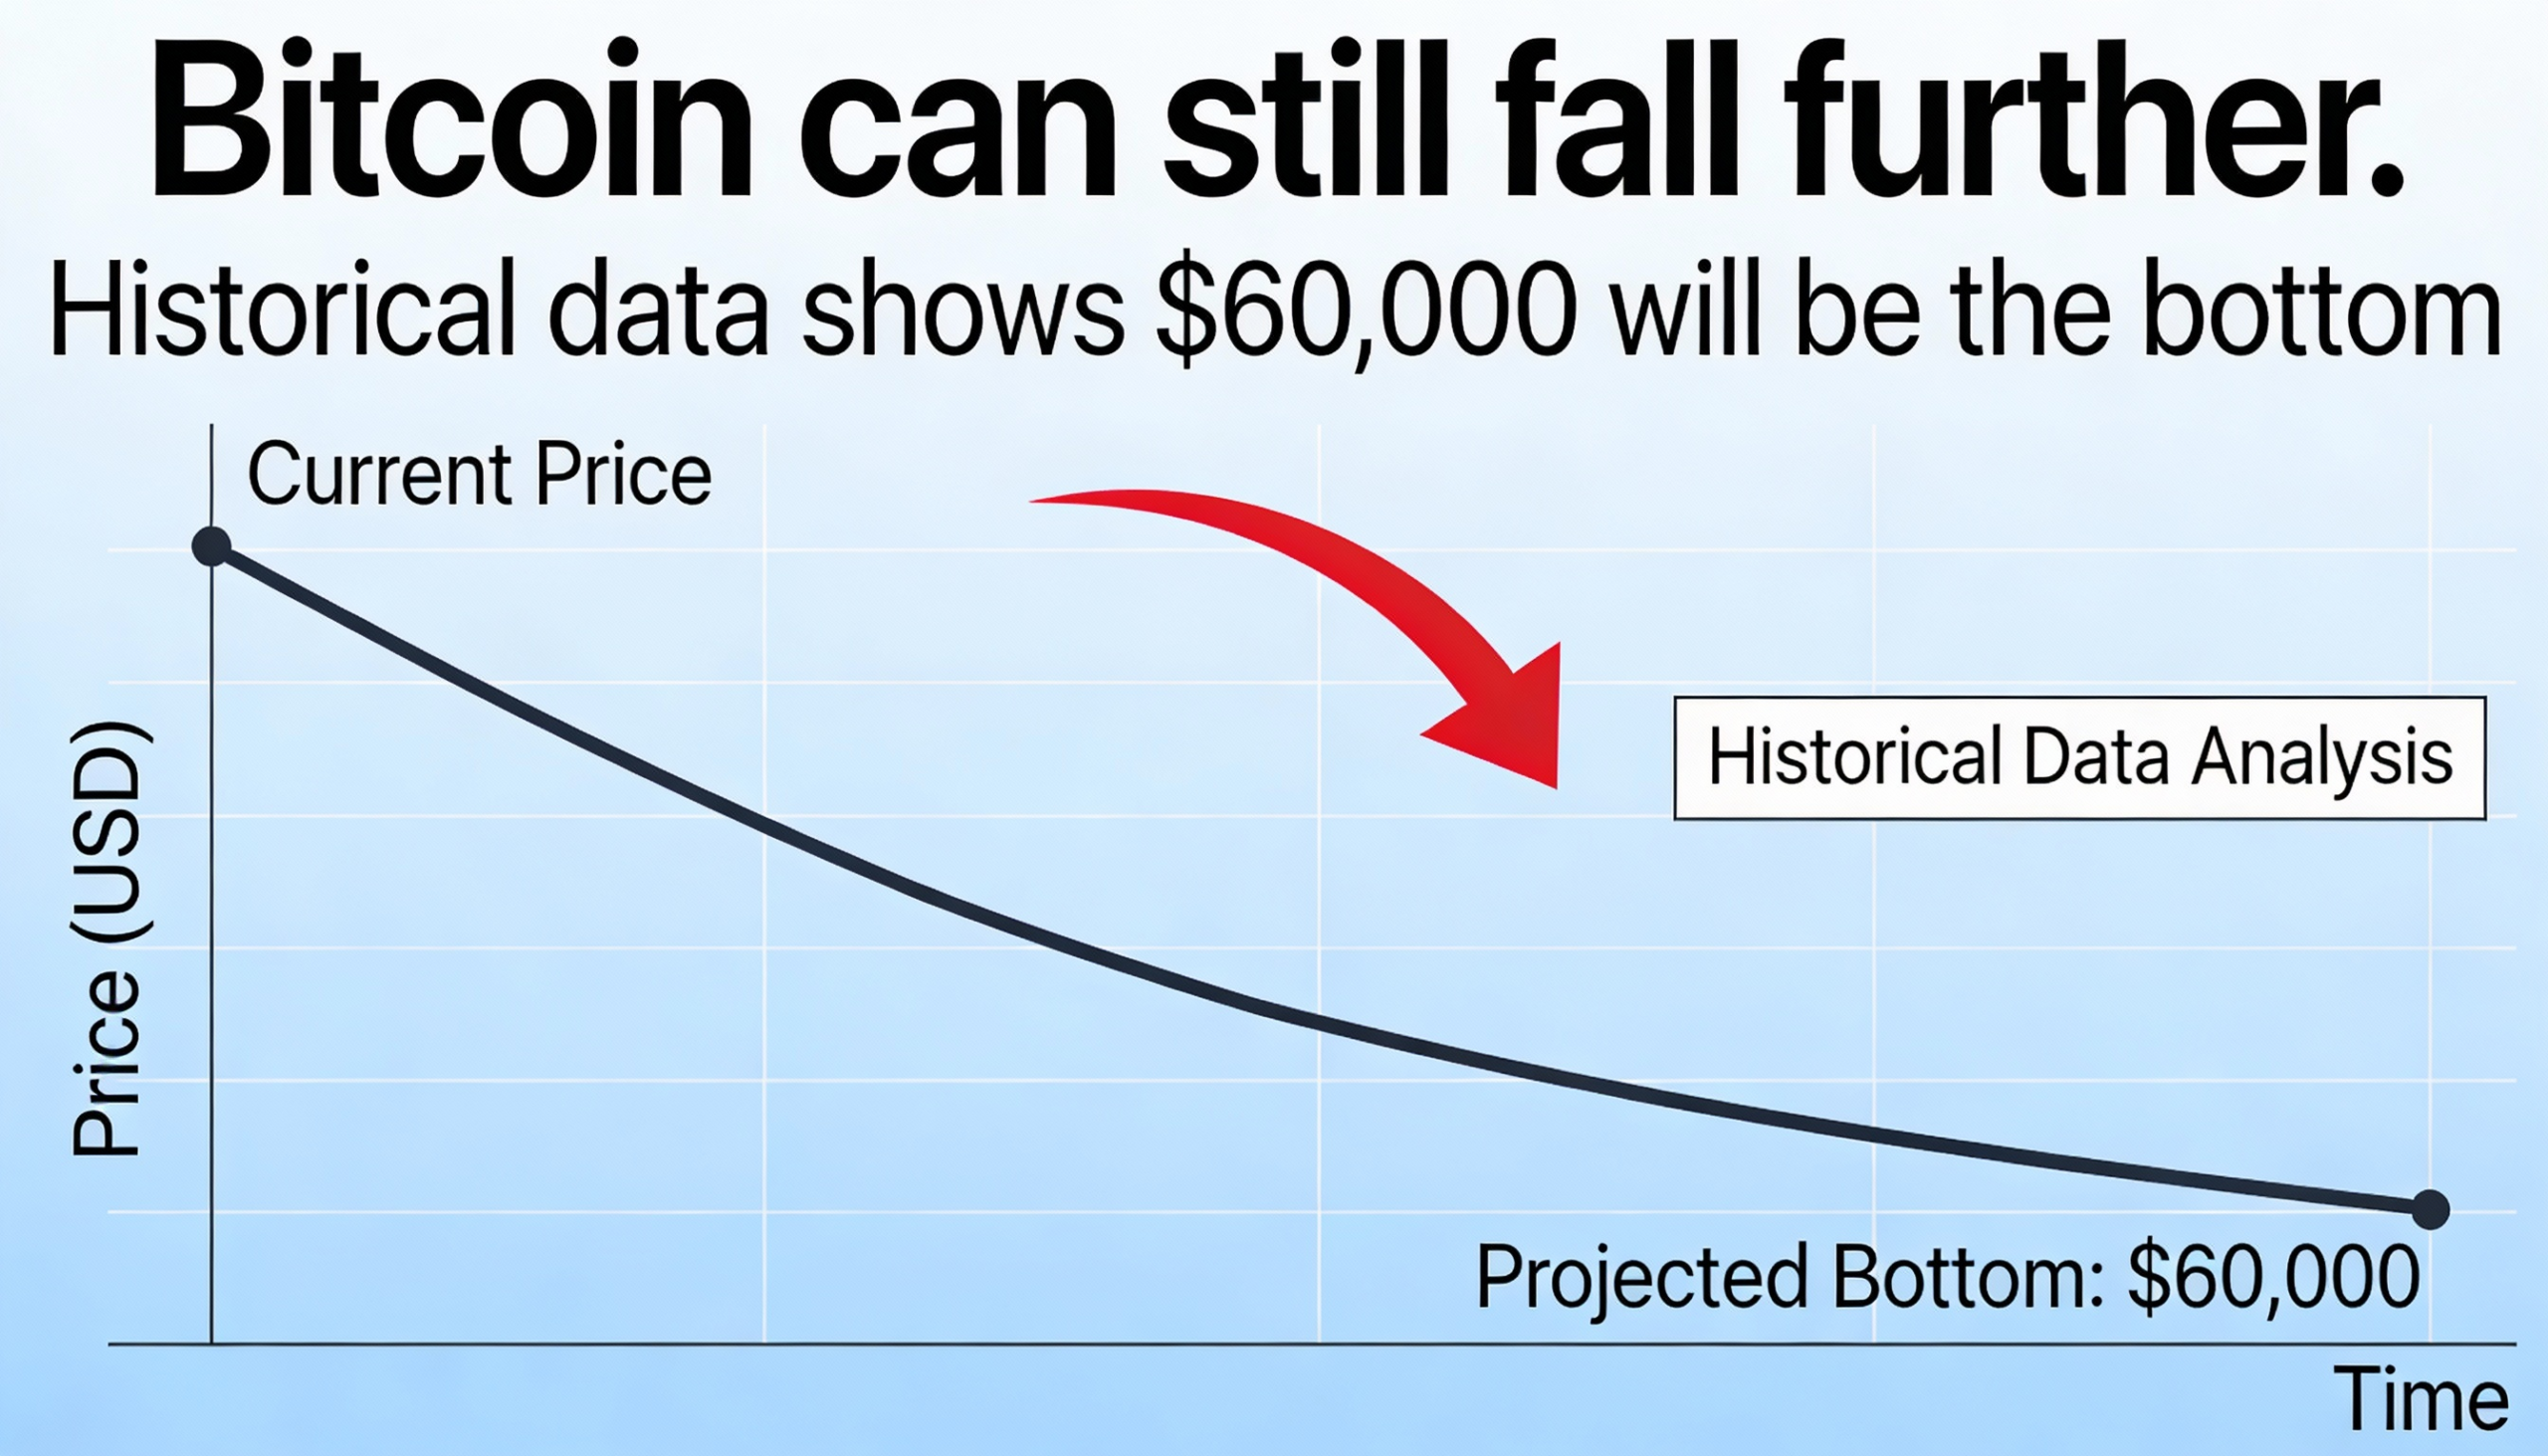
History suggests Bitcoin has room to fall, with $60,000 marking a likely bottom
Bitcoin’s recent slide has revived concerns that the market could face further downside, with long-term historical data pointing to the 200-week moving average as a critical level to watch.
The largest cryptocurrency fell 11% last week to about $74,800, marking its steepest weekly decline since March 2025. While the drop has already shaken investor confidence, technical signals suggest the correction may not yet be complete. A decline toward $58,000—roughly 25% below current prices—would bring bitcoin back to its 200-week moving average, a level that has historically acted as support during bear markets.
Weak demand following the selloff has added to fears of another extended downturn. Past cycles suggest that major bottoms tend to form slowly, often after prolonged periods of weakness rather than sharp, single-leg declines.
The 200-week moving average, which tracks bitcoin’s average closing price over nearly four years, is widely used as a long-term trend indicator and as a reference point for bitcoin’s four-year market cycle. In every previous cycle, the indicator has either marked or closely coincided with major market lows. The level currently stands near $57,900.
Bitcoin has historically peaked in the fourth quarter of the final year of each cycle. In the current cycle, it reached a record high of $126,000 in October and has since declined by around 40%. Last week’s selloff also pushed bitcoin below the Ichimoku Cloud on the weekly chart, a technical indicator that measures trend strength, momentum, and support.
Trading above the Ichimoku Cloud typically signals strong bullish conditions, while sustained moves below it suggest weakening momentum and greater vulnerability to extended losses. Bitcoin’s break below the cloud is a bearish development that, in past cycles, has preceded the most severe phases of bear markets.
The broader price action continues to align with the four-year cycle theory, which is closely linked to bitcoin’s halving schedule. The halving reduces new supply by 50% roughly every four years and has historically contributed to recurring boom-and-bust dynamics.
In the 2015 bear market, bitcoin consistently found support near the 200-week moving average at prices just above $200. During the 2018–2019 downturn, the same indicator, then near $3,000, again acted as a floor, aside from a brief breakdown during the Covid-driven market crash in March 2020.
More recently, bitcoin fell below the 200-week moving average in June 2022, dropping under $22,000 and remaining below the level for more than a year. The price did not reclaim the line until October 2023, reinforcing its role as a key long-term support indicator.
While historical patterns offer no certainty, the combination of bitcoin’s break below the Ichimoku Cloud and its distance from the 200-week moving average suggests further downside may be possible before a durable bottom forms—likely near a level that has repeatedly provided support in past cycles.
Share this content: