An oversold RSI is flashing for Bitcoin. What comes next?
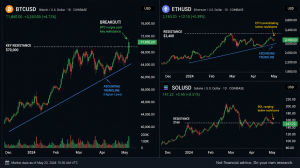
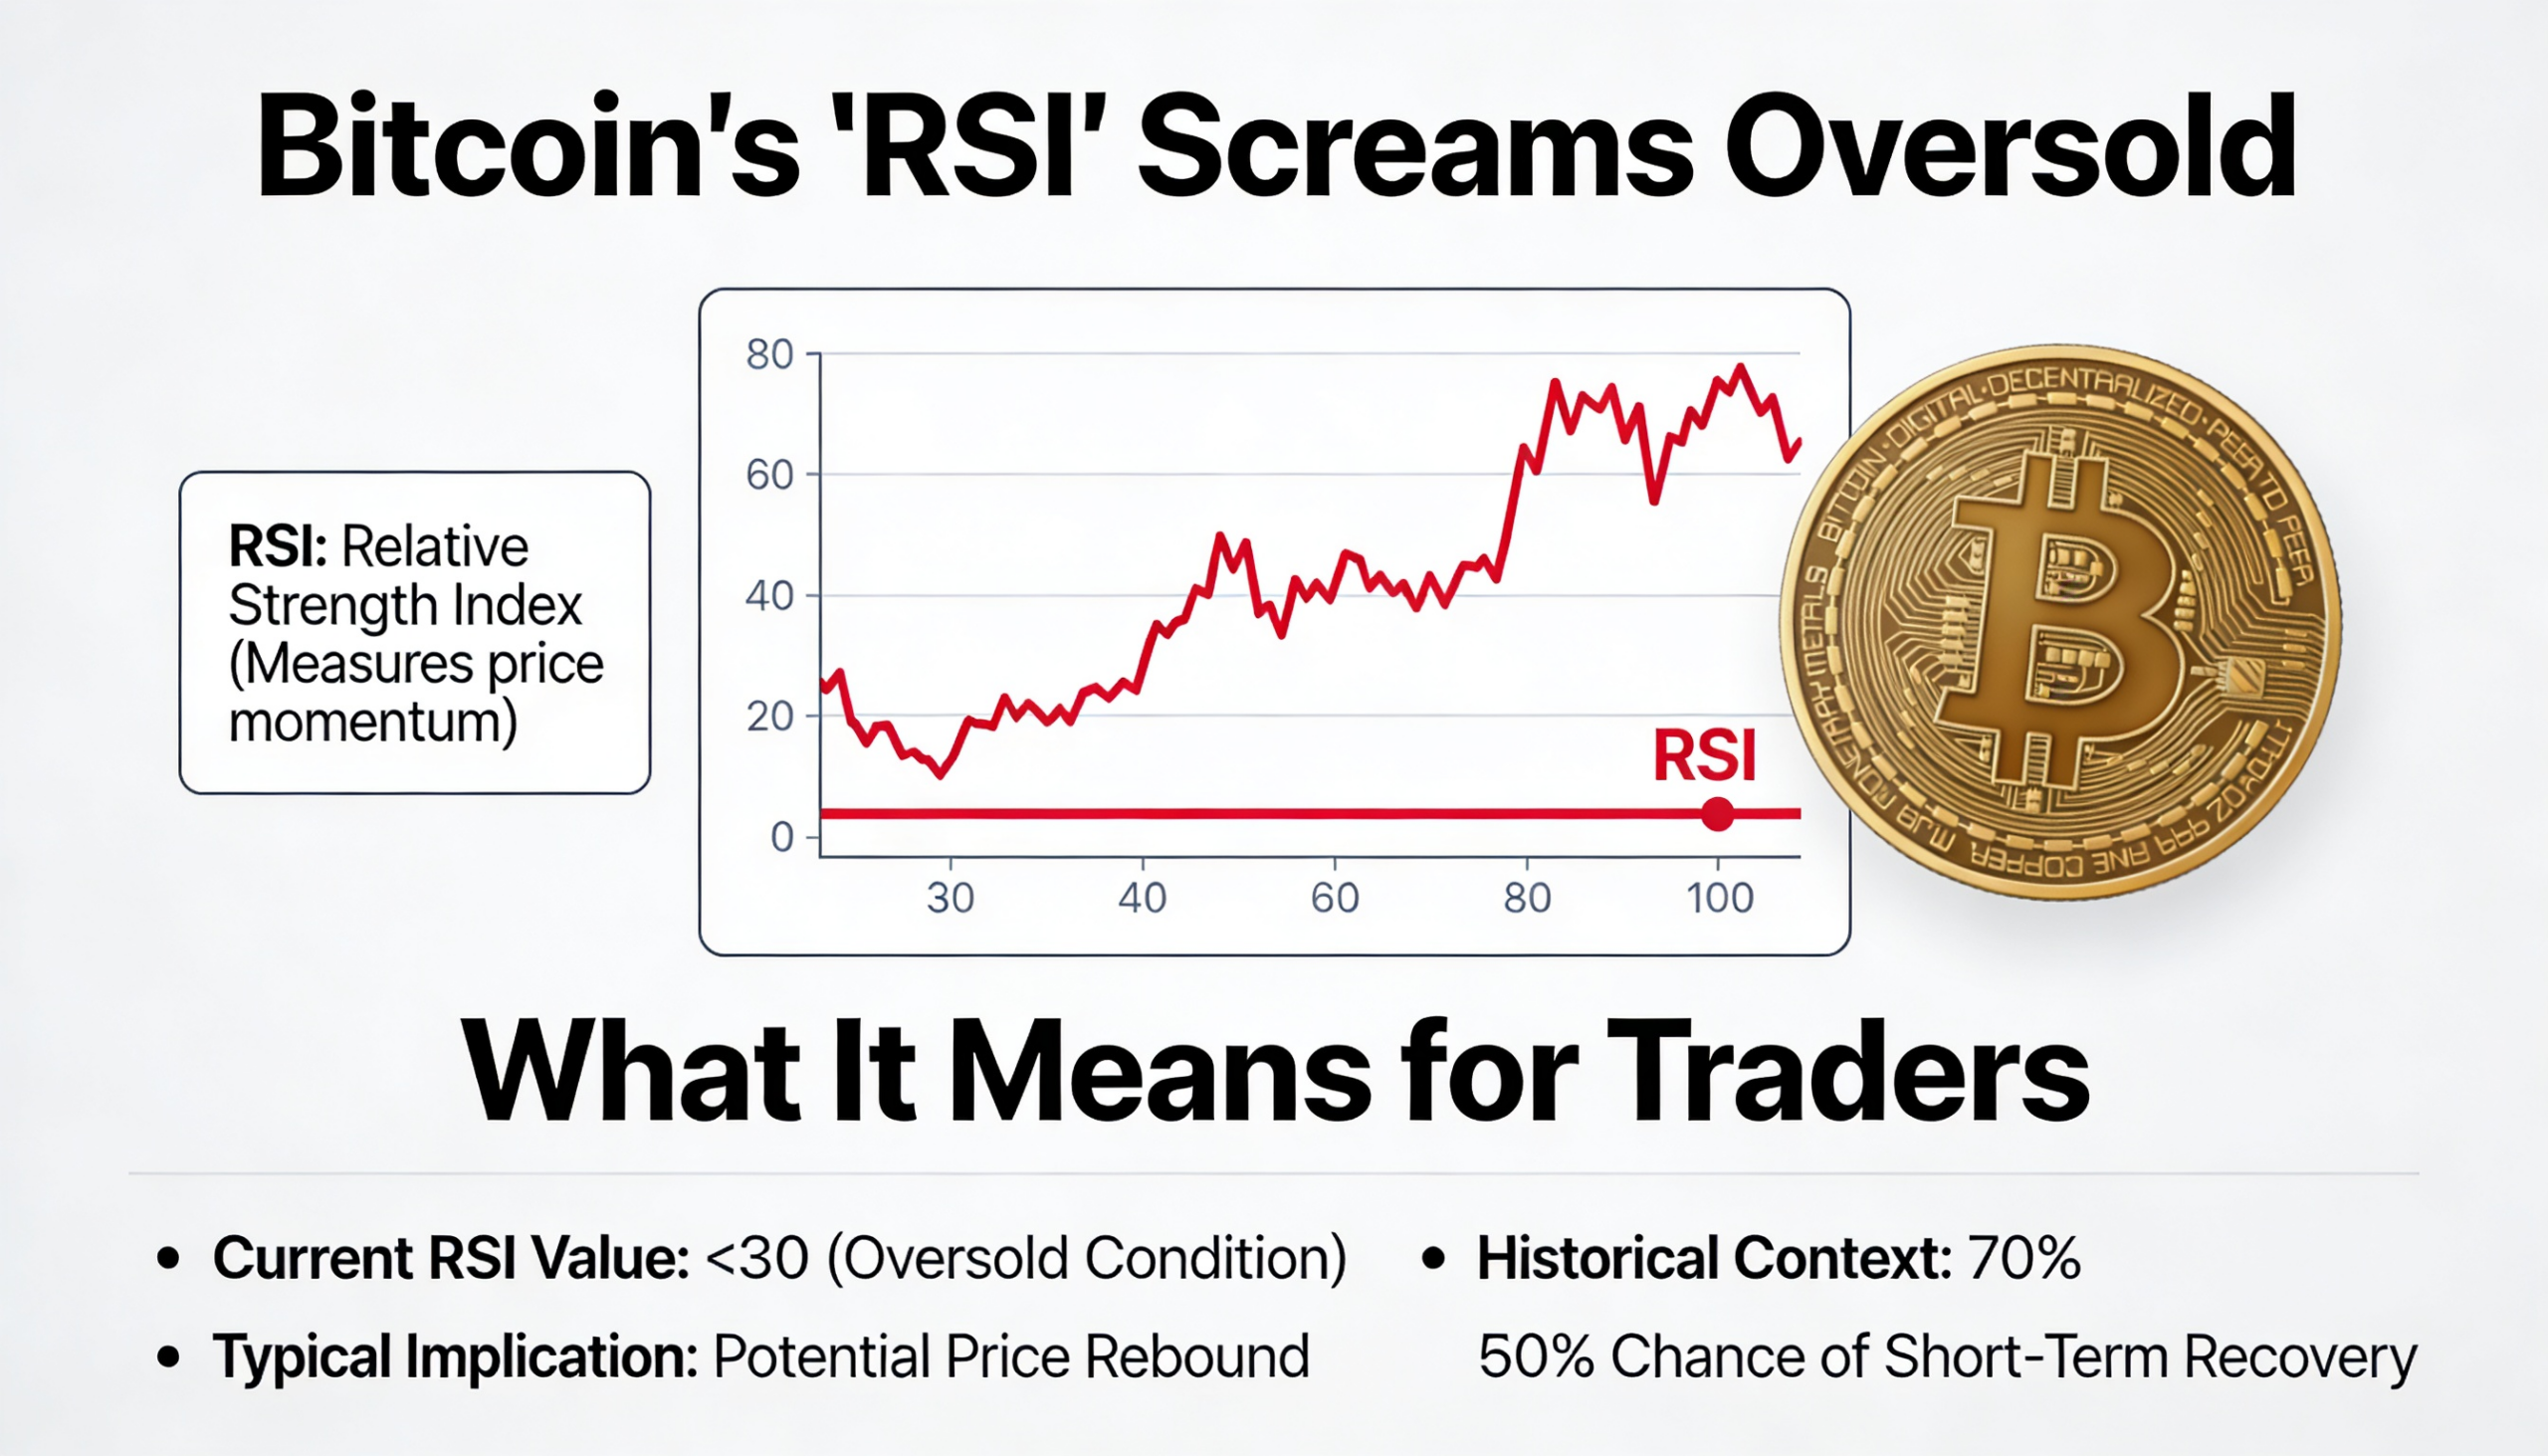
Bitcoin’s relative strength index (RSI) has slipped below the 30 level, a signal commonly associated with oversold conditions, as the cryptocurrency trades near a closely watched support range between $73,000 and $75,000.
The RSI is a staple of technical analysis, used by traders to gauge momentum and identify potential price extremes. Created in 1978 by mechanical engineer and technical analyst J. Welles Wilder Jr., the indicator was introduced in his book New Concepts in Technical Trading Systems and remains widely used across global markets.
The metric compares recent gains and losses over a standard 14-day period, producing a reading that fluctuates between zero and 100. When the RSI falls below 30, it indicates that selling pressure has overwhelmed buying interest over the recent period, reflecting strong bearish momentum.
Such conditions are typically described as oversold, suggesting prices may have declined too far, too quickly relative to recent norms. While an oversold reading does not guarantee a reversal, markets often experience short-term rebounds after the RSI reaches these levels.
That tendency can become self-reinforcing. Because many discretionary traders and algorithmic strategies monitor RSI signals, buying interest often emerges when the indicator reaches extreme readings, increasing the likelihood of a relief rally.
The signal carries greater significance when it aligns with established support levels. Bitcoin is currently hovering near the $73,000–$75,000 zone, an area that has repeatedly influenced price action. A sell-off in April 2025 stalled within this range, and the early-2024 rally also faltered at similar levels, underscoring its role as a key battleground between buyers and sellers.
Together, the oversold RSI and nearby support suggest conditions may be forming for a bounce. However, any rebound should not be interpreted as confirmation of a new bull market.
Like all technical indicators, the RSI can generate false or short-lived signals, particularly during broader bearish phases. In 2022, oversold readings produced only modest recoveries. More recently, a similar signal in November was followed by weeks of consolidation before a renewed downturn last month.
For now, the RSI highlights stretched selling pressure, but whether that translates into a sustained recovery will depend on the broader market environment.
Share this content: