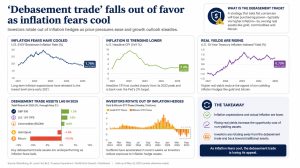
Gold flirts with a 50-year high while bitcoin strains against crucial support.
Adjusted for the size of the U.S. money supply, gold has returned to levels that have historically coincided with major peaks, while bitcoin is sliding back toward a support zone that has shaped previous market cycles.
Gold is currently testing a critical threshold relative to U.S. money supply (M2SL), a level last seen in 2011 and previously surpassed only during the inflationary 1970s. That earlier period ultimately produced a powerful multi-year rally, with gold prices more than tripling to a then-record near $700 an ounce.
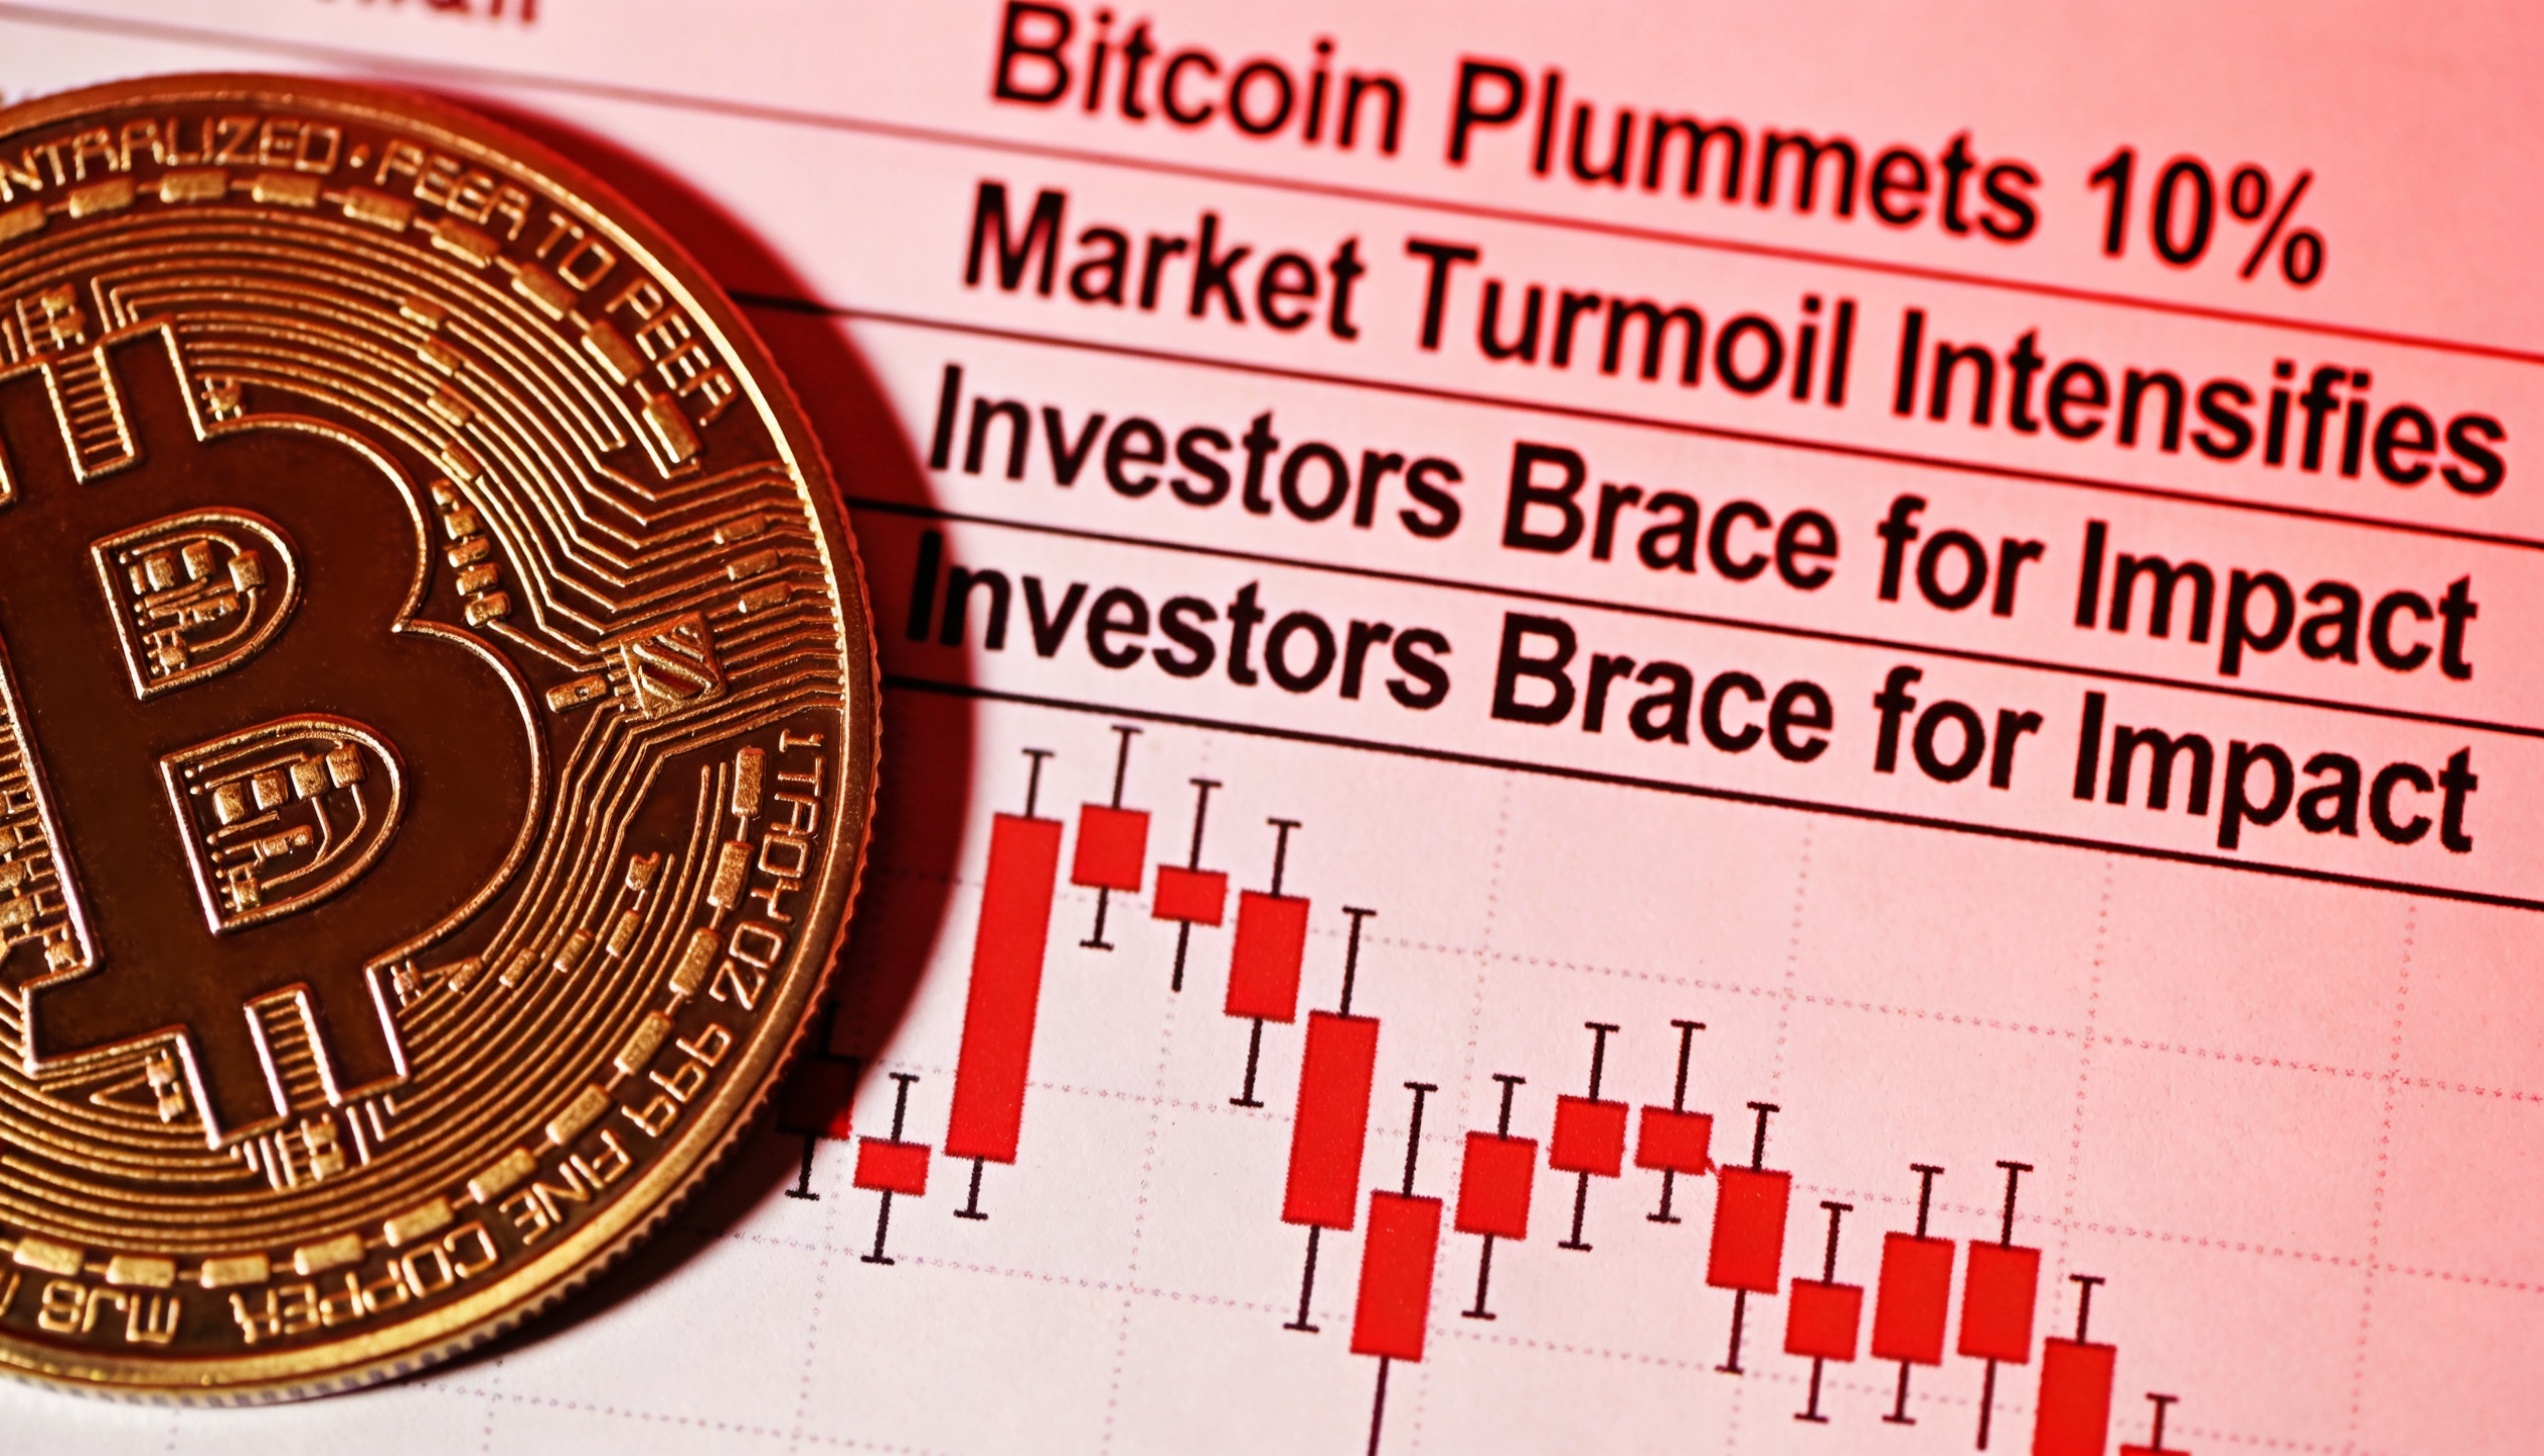
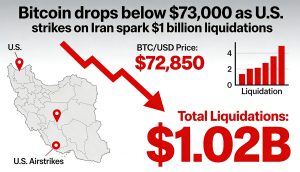
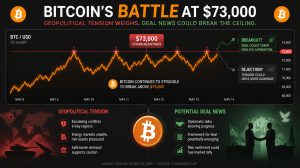
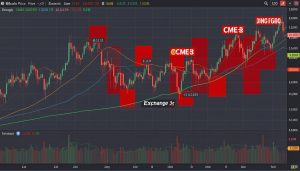
Bitcoin, often described by proponents as “digital gold,” is moving in the opposite direction. The cryptocurrency has retraced toward an important support level, revisiting prices last seen during April’s so-called “tariff tantrum.”
In 2011, gold traded near $1,800 an ounce. Today, it sits around $4,500. When set against the total stock of dollars circulating in the U.S. economy — including cash, bank deposits and liquid savings — gold is once again pressing into a resistance zone that has historically marked major inflection points.
The move has been driven by a roughly 70% rally in gold prices this year. Bitcoin, by contrast, is down about 10% over the same period. Even so, bitcoin continues to make higher highs relative to the U.S. money supply each cycle, and the current pullback is testing a level that also marked the prior cycle peak in March 2024.
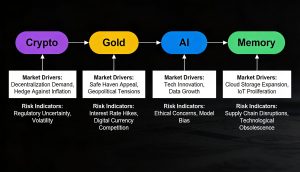
The divergence highlights the differing roles gold and bitcoin are playing as both assets approach technically important levels.
Share this content: