A Key Bitcoin Indicator Turns Green — Here’s Where BTC Could Head Next
Bitcoin receives bullish momentum signal as traders focus on key resistance barriers
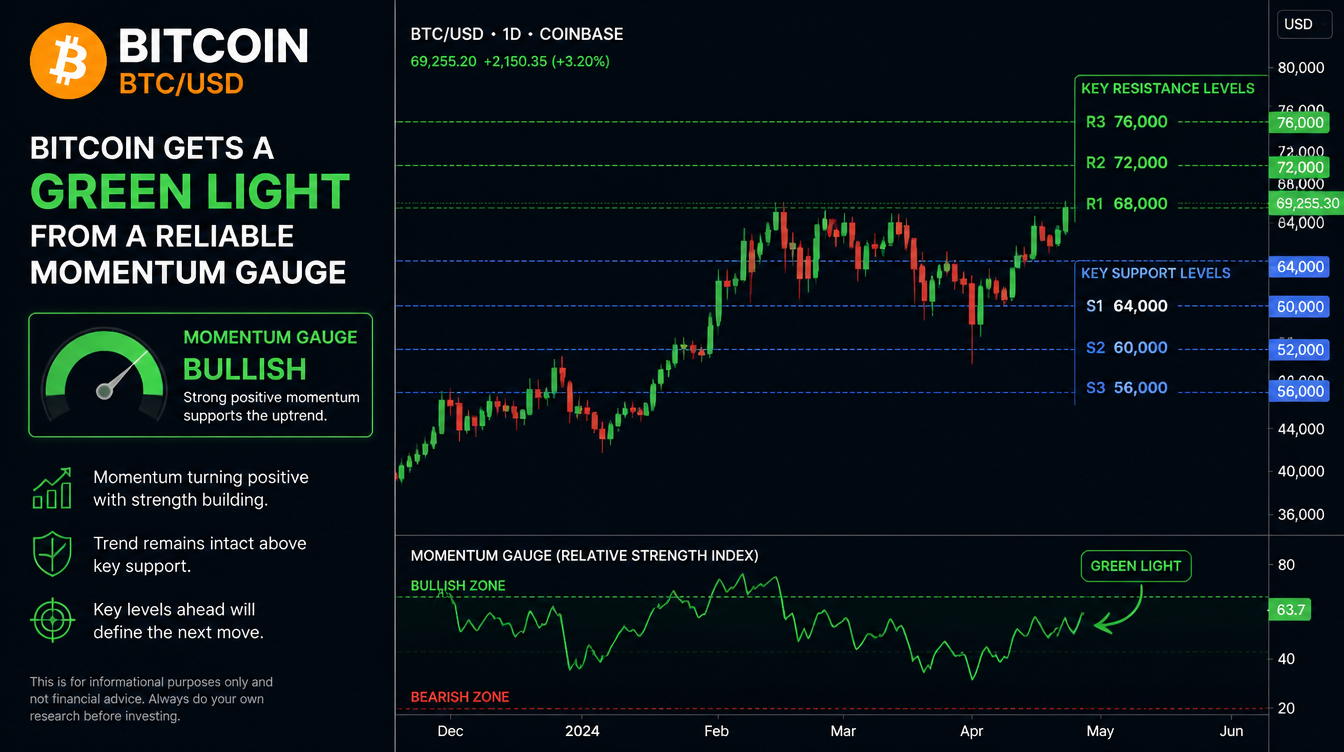
Bitcoin’s longer-term momentum outlook has improved after a smoother MACD indicator turned bullish, suggesting the current recovery could extend further. However, the cryptocurrency still needs to overcome several important price hurdles before confirming a broader upward trend.
BTC has gained almost 10% this month and is showing potential to move toward the $70,000 region, a level that has repeatedly stopped previous rallies.
The positive signal comes from the moving average convergence divergence (MACD) histogram, a popular technical tool used to evaluate trend direction and market momentum. When the histogram moves above the zero line, it generally indicates increasing bullish strength, while a move below zero signals weakening momentum.
The standard MACD model relies on 12-day and 26-day moving averages along with a 9-day signal line. However, these shorter time frames can often generate misleading signals during volatile periods. To reduce short-term market noise, many traders use longer-term settings, including 50-day and 100-day moving averages paired with a 9-day signal line.
The longer-term MACD histogram has now moved above zero, marking a shift toward stronger positive momentum. This suggests bitcoin’s recent rebound may have further room to develop instead of quickly losing steam. At the time of analysis, BTC was trading slightly above $64,000.
Although traders typically combine multiple indicators before making market decisions, this version of the MACD has historically provided useful signals during major bitcoin price cycles. Since BTC fell from its record peak near $126,000, bearish MACD crossovers have often appeared ahead of larger declines, while bullish signals have been followed by meaningful recoveries, including the December–January and February–May rallies.
The latest bullish crossover supports the possibility of additional gains, but it does not automatically confirm the start of a new long-term bull market. Traders are now watching several resistance levels that could determine whether bitcoin’s recovery continues.
Critical Bitcoin Levels Ahead
$65,434 — 50-day moving average
The first important level is the 50-day simple moving average, which reflects bitcoin’s average price over the previous 50 trading sessions. Market participants closely follow this indicator to measure short-term trend strength. A sustained move above it could indicate that buyers are gaining control.
$67,292 — Previous mid-June high
The next major resistance sits at $67,292, the level where bitcoin reached a temporary peak in mid-June before sellers pushed the price lower. A breakout above this zone would represent a significant victory for buyers and suggest stronger upside momentum.
$71,147 — 200-day moving average
The most important technical barrier is the 200-day moving average near $71,147. This indicator is widely viewed as a measure of bitcoin’s long-term trend. BTC previously failed to break above this area during its May recovery attempt, making a successful move beyond it a key signal of a possible trend reversal.
Until bitcoin clears these levels, traders are likely to remain cautiously optimistic rather than fully confident in a new bullish cycle.
$80,000 Options Market Could Add Volatility
Beyond technical indicators, traders are also monitoring the $80,000 strike price in Deribit’s bitcoin options market. The level carries more than $1.21 billion in open interest, the highest concentration of options exposure on the exchange.
If bitcoin moves closer to $80,000, adjustments by options traders could increase activity in spot and derivatives markets, potentially creating sharper price swings.
Share this content: