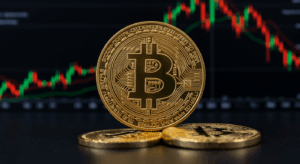
Bitcoin Sees 14 Straight Positive Hourly Candles, Its Longest Run Since 2017.
K33 Research notes that such price movements have been rare occurrences since 2017.
During European trading hours on Friday, Bitcoin’s (BTC) price action left many traders puzzled, and understandably so.
If you examined the BTCUSD candlestick chart on Coinbase, you would notice fourteen consecutive green hourly candles. This means that Bitcoin experienced a gain every hour for the past 14 hours. The surge began at 21:00 UTC on January 9 and extended through 10:00 UTC on January 10, pushing the price up from $91,771 to $95,283.
The continuous green candles caught the attention of traders, with many on X expressing confusion.
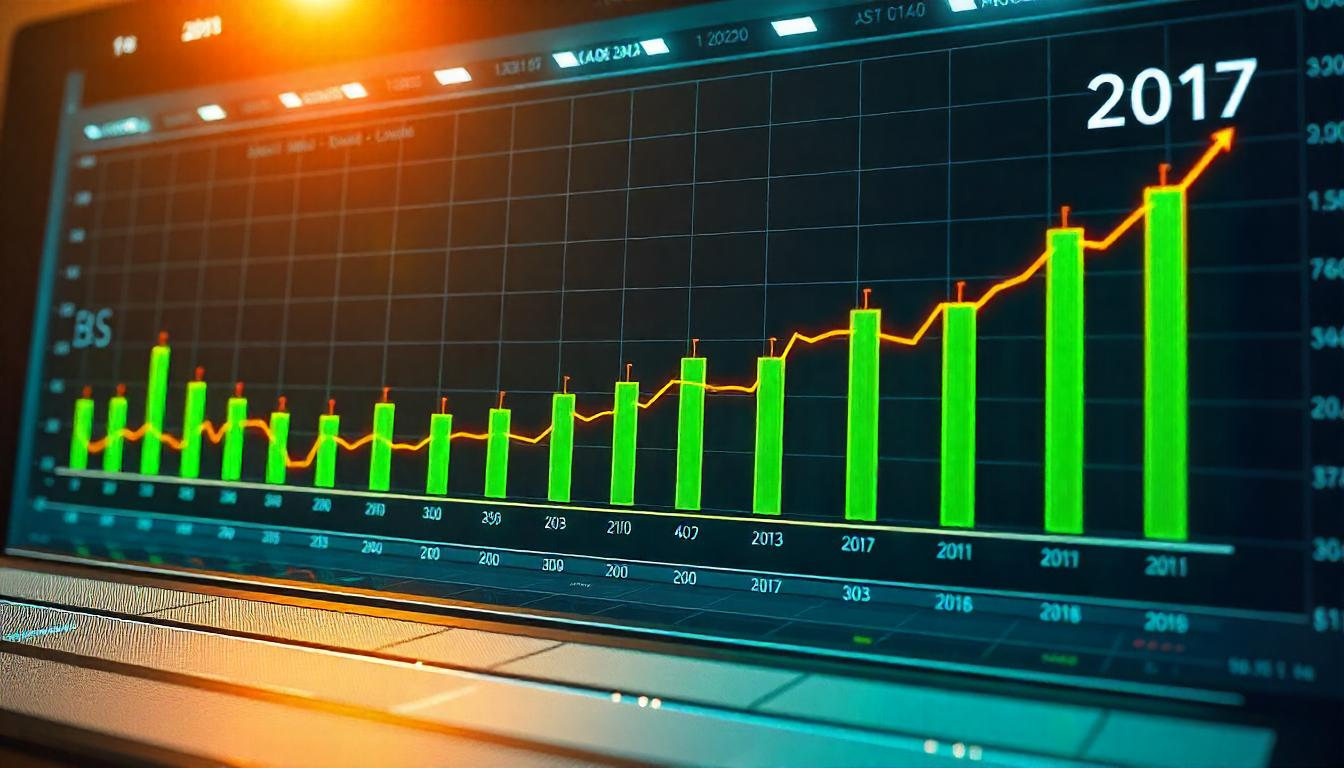
Vetle Lunde, Senior Analyst at K33 Research, reviewed historical data to find instances of similar price action. The current streak of 14 green hourly candles is the longest since January 1, 2017, when Bitcoin saw 11 consecutive green hourly candles.
However, this type of price pattern isn’t new. Bitcoin has shown similar streaks on January 14, 2023 (11), February 26, 2024 (11), and November 12, 2024 (11).
As of now, the 15th hourly candle has turned red, possibly signaling the end of the streak, with it scheduled to close at 12:00 UTC.
Share this content: