The Fallout of the U.S. Bitcoin ETF Cash-and-Carry Trade Collapse: What Investors Need to Know
Bitcoin ETF Inflows Decline Amid Market Uncertainty and Basis Trade Reversal
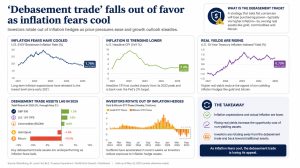
The momentum behind U.S. spot bitcoin ETFs has weakened in 2025, with inflows slowing compared to the strong demand witnessed in 2024.
Over the past month, these ETFs have seen net outflows of $180 million, marking one of the steepest withdrawal periods since their launch in early 2024.
The performance of bitcoin ETFs this year has been underwhelming, largely due to bitcoin’s price slump of approximately 10%. Despite a brief surge over the last five days—bringing in around $700 million in net inflows—total cumulative inflows since inception now stand at $36.1 billion, as per Farside data.
Two primary factors are driving the recent ETF outflows: heightened bitcoin price volatility and the unwinding of the basis trade strategy.
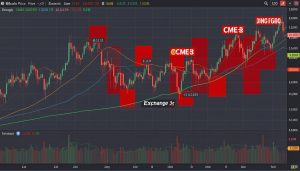
Bitcoin’s price has exhibited significant swings in 2025, reaching a record high of $109,000 in January amid optimism over President Donald Trump’s pro-crypto stance. However, it subsequently dropped to $76,000 in early March due to mounting concerns over the administration’s tariff-driven economic policies.
Retail investors often respond emotionally to volatility, selling off assets during downturns. On the institutional side, many have been closing out their basis, or cash-and-carry, trades. This arbitrage strategy involves holding a long position in a bitcoin ETF while simultaneously shorting CME bitcoin futures to take advantage of futures premiums over spot prices in a delta-neutral manner.
Currently, this arbitrage opportunity yields only about 2%, among the lowest since the ETFs were introduced. With U.S. Treasury yields providing more attractive and low-risk returns, many investors are reallocating funds to traditional fixed-income assets.
Historically, ETF inflows and outflows have acted as indicators of bitcoin’s price direction. When outflows accelerate, they often align with local price bottoms, especially when analyzed on a 30-day moving average. This trend was evident in March’s price dip, as well as during notable corrections in April and August 2024.
Share this content: