Bearish Chart Setup Returns as Bitcoin and XRP Retreat
A once-familiar bitcoin chart formation has resurfaced as traders debate whether the latest pullback in major cryptocurrencies could develop into a bearish “Bart Simpson” pattern.
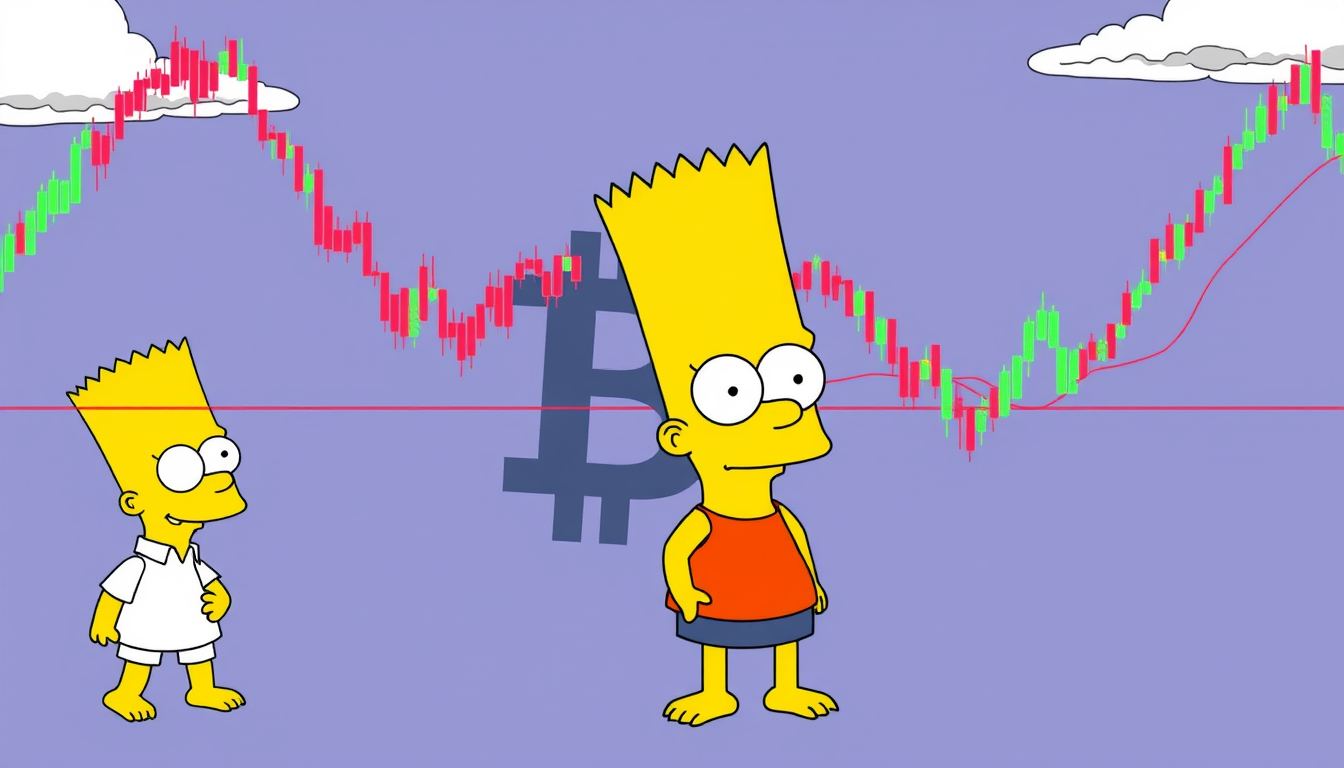
The nickname comes from Bart Simpson’s sharply pointed hairstyle. On a price chart, the pattern typically appears when an asset makes a rapid move, settles into a relatively flat trading range and then abruptly reverses, creating a silhouette that resembles the cartoon character.
Bitcoin (BTC), XRP and ether (ETH) have all retreated after their recent advances, prompting traders to revisit the formation. The term was originally coined in 2015 by former X user @whaleclubco, when bitcoin was trading at $229. The pattern had not been widely discussed in connection with BTC for at least three years before it resurfaced on Sept. 1.
The renewed speculation spread across crypto X, where Ben Cowen, founder of Into the Cryptoverse and a market analyst, told his 1.2 million followers that bitcoin appeared to be developing a Bart Simpson-like structure.
The setup can be broken into three stages. It starts with the Spike, a fast and pronounced move in either direction that can cause traders to chase momentum. The market then enters the Flat Range, or “head,” where prices move sideways within a relatively narrow band and volume generally declines. The final stage is the Snap Back, which occurs when prices reverse sharply against the direction of the initial move.
Bitcoin’s current formation traces back to Aug. 19, when BTC was changing hands at about $64,420. By Aug. 21, it had gained nearly $14,000 to reach around $78,300. Bitcoin eventually ran into resistance just below $80,700 on Aug. 25. At the time of writing, BTC was trading around $76,500, according to CoinDesk data.
The combination of the rally, consolidation and subsequent retreat now gives the bitcoin chart a shape that resembles Bart Simpson, with the potential Snap Back phase underway.
The interpretation remains controversial among traders. Some expect bitcoin to resume its advance and dismiss the pattern as incomplete, while others believe a larger retracement could offer a chance to buy before another bullish move.
Mati Greenspan, founder of Quantum Economics and former senior analyst at eToro, said a bitcoin decline of at least 20% would be needed before the formation could properly be called a Bart Simpson pattern. He nonetheless said he does not expect that scenario.
According to Greenspan, the pattern was more characteristic of bitcoin’s early market, when trading conditions were thinner and less mature.
He said clean examples have been rare in recent years. While the setup can still occur, increased liquidity, deeper markets and stronger institutional participation have seemingly pushed it out of bitcoin’s more typical price behavior.
Greenspan said the same concept can apply to other cryptocurrencies, with XRP offering a potentially stronger example.
XRP’s almost vertical rise from approximately $1 to $1.70 has created the kind of price structure associated with the pattern. Greenspan said a major retracement toward the beginning of the rally would make the comparison even more convincing.
The XRP move began on Aug. 19, matching the timing of bitcoin’s Spike. XRP rose from around $1 to $1.52 by Aug. 22 before shifting into the Flat Range phase. Although the token has remained within that range, its direction has been gradually lower, with XRP trading around $1.32 at the time of writing.
Frank Hepworth, CEO and founder of New Market Trading, considers the pattern a potential warning that the market is entering a distribution phase. He said the formation can occur when larger holders sell into demand from retail investors.
Hepworth pointed to bitcoin’s repeated failures around its 50-week moving average near $81,000 as the source of the pattern’s distinctive “hair.” He described that moving average as the “last line in the sand” for bears.
With bitcoin unable to break that barrier, Hepworth sees $70,000 as a possible downside target. If selling becomes more aggressive, he believes BTC could eventually fall toward $58,000, prompting his firm to reduce its market exposure.
XRP could be especially vulnerable in a downturn, Hepworth said, because the token has recently weakened against bitcoin.
The XRP/BTC pair has slipped below its 20-week moving average. Hepworth expects that deterioration could translate into further underperformance by XRP if cryptocurrencies enter a broader correction.
Under his scenario, a bitcoin decline toward $70,000 could send XRP to between $0.55 and $1.21. If BTC falls to $58,000, XRP could potentially sink to $0.46.
Share this content: